Passyunk Discount Shopping neighborhood in Philadelphia, Pennsylvania (PA), 19148 detailed profile
Settings
X


Business Search - 14 Million verified businesses
Area: 0.032 square miles
Population: 2,027
Population density:
| Passyunk Discount Shopping: | 63,893 people per square mile |
| Philadelphia: | 11,602 people per square mile |

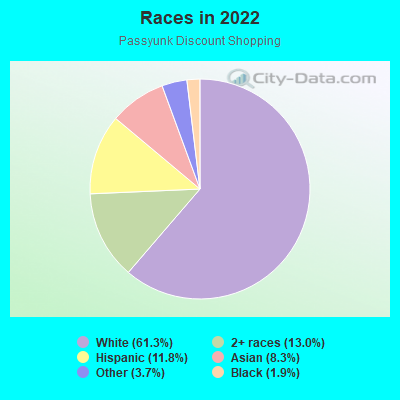
- 1,30361.3%White
- 27713.0%Two or more races
- 25011.8%Hispanic or Latino
- 1768.3%Asian
- 783.7%Some other race
- 401.9%Black
Distribution of median household income
![Distribution of median household income]()
- 100Less than $10,000
- 240$10,000 to $19,999
- 407$20,000 to $29,999
- 29$30,000 to $39,999
- 77$40,000 to $49,999
- 69$50,000 to $59,999
- 59$60,000 to $74,999
- 115$75,000 to $99,999
- 85$100,000 to $124,999
- 68$125,000 to $149,999
- 190$150,000 to $199,999
- 435$200,000 or more

Distribution of owner-occupied house/condo value
![Distribution of owner-occupied house/condo value]()
- 59Less than $50,000
- 4$50,000 to $99,999
- 71$100,000 to $149,999
- 26$150,000 to $199,999
- 41$200,000 to $249,999
- 98$250,000 to $299,999
- 111$300,000 to $399,999
- 142$400,000 to $499,999
- 244$500,000 to $749,999
- 161$750,000 to $999,999
- 164$1,000,000 or more

Distribution of rent paid by renters
![Distribution of rent paid by renters]()
- 5$300 to $399
- 205$700 to $799
- 92$800 to $899
- 163$900 to $999
- 96$1,000 to $1,249
- 60$1,250 to $1,499
- 110$1,500 to $1,999
- 49$2,000 or more

Median rent in 2022:
| Passyunk Discount Shopping: | $1,041 |
| Philadelphia: | $1,073 |
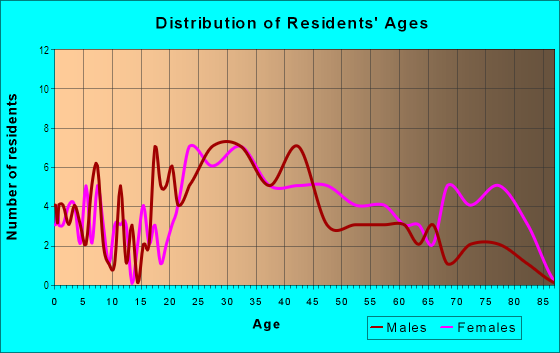
| Males: | 979 |
| Females: | 1,047 |
Males:
| This neighborhood: | 40.9 years |
| Whole city: | 34.1 years |
| This neighborhood: | 37.4 years |
| Whole city: | 36.3 years |
Average household size:
| Passyunk Discount Shopping: | 1.7 people |
| Philadelphia: | 2.2 people |
Percentage of family households:
| Passyunk Discount Shopping: | 26.6% |
| Philadelphia: | 36.5% |
| Here: | 27.5% |
| Philadelphia: | 28.0% |
Percentage of married-couple families with children (among all households):
| Passyunk Discount Shopping: | 42.8% |
| Philadelphia: | 23.5% |
Percentage of single-mother households (among all households):
| Passyunk Discount Shopping: | 10.3% |
| Philadelphia: | 17.6% |
Percentage of never married males 15 years old and over:
Percentage of never married females 15 years old and over:
| Passyunk Discount Shopping: | 27.9% |
| Philadelphia: | 23.9% |
Percentage of never married females 15 years old and over:
| Passyunk Discount Shopping: | 21.4% |
| city: | 26.0% |
Percentage of people that speak English not well or not at all:
| Passyunk Discount Shopping: | 5.2% |
| Philadelphia: | 7.0% |
Percentage of people born in this state:
Percentage of people born in another U.S. state:
Percentage of native residents but born outside the U.S.:
Percentage of foreign born residents:
| Here: | 53.2% |
| Philadelphia: | 61.6% |
Percentage of people born in another U.S. state:
| Passyunk Discount Shopping: | 30.7% |
| Philadelphia: | 18.9% |
Percentage of native residents but born outside the U.S.:
| Here: | 1.4% |
| city: | 3.7% |
Percentage of foreign born residents:
| Here: | 14.7% |
| Philadelphia: | 15.7% |
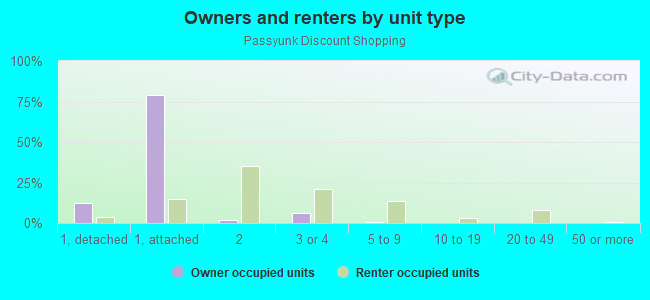
Owner-occupied
Renter-occupied

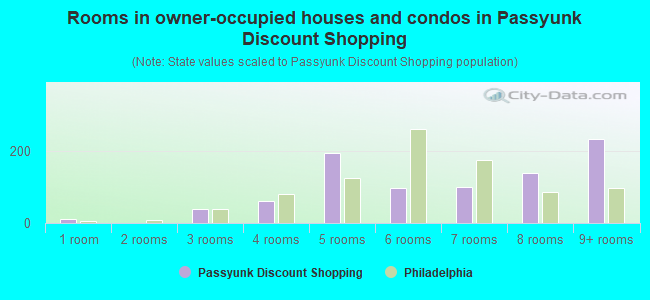
- Rooms in owner-occupied houses and condos in Passyunk Discount Shopping
- 101 room
- 02 rooms
- 393 rooms
- 604 rooms
- 1955 rooms
- 976 rooms
- 1007 rooms
- 1398 rooms
- 2349+ rooms
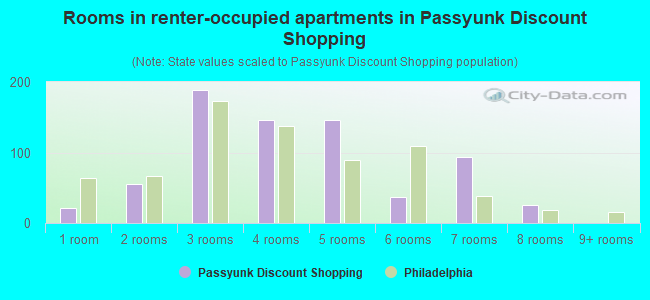
- Rooms in renter-occupied apartments in Passyunk Discount Shopping
- 211 room
- 552 rooms
- 1883 rooms
- 1464 rooms
- 1465 rooms
- 376 rooms
- 937 rooms
- 258 rooms
- 09+ rooms
Owner-occupied
Renter-occupied
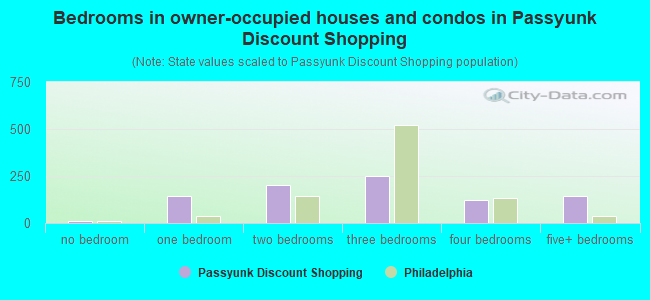
- Bedrooms in owner-occupied houses and condos in Passyunk Discount Shopping
- 10no bedroom
- 1431 bedroom
- 2042 bedrooms
- 2503 bedrooms
- 1214 bedrooms
- 1455+ bedrooms
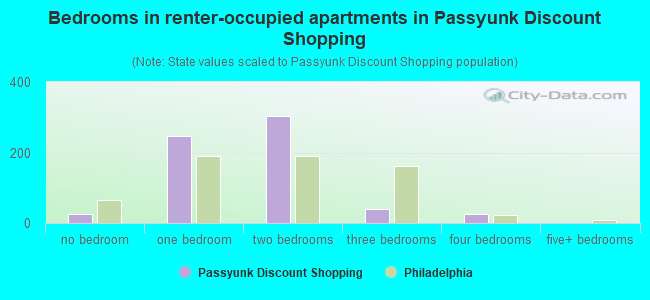
- Bedrooms in renter-occupied apartments in Passyunk Discount Shopping
- 26no bedroom
- 2471 bedroom
- 3042 bedrooms
- 403 bedrooms
- 254 bedrooms
- 05+ bedrooms
Average number of cars or other vehicles available in houses/condos:
Average number of cars or other vehicles available in apartments:
| This neighborhood: | 1.0 |
| Philadelphia: | 1.3 |
Average number of cars or other vehicles available in apartments:
| Here: | 0.7 |
| city: | 0.8 |
Percentage of units with a mortgage:
| Passyunk Discount Shopping: | 53.8% |
| Philadelphia: | 58.9% |
Average estimated value of townhouses or other attached units in 2022 (55.2% of all units):
| This neighborhood: | $327,908 |
| city: | $243,508 |
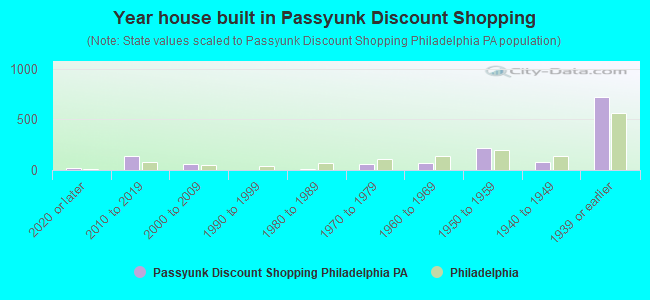
- Year house built in Passyunk Discount Shopping
- 212020 or later
- 1372010 to 2019
- 632000 to 2009
- 41990 to 1999
- 111980 to 1989
- 591970 to 1979
- 721960 to 1969
- 2201950 to 1959
- 791940 to 1949
- 7161939 or earlier
City-data.com crime index for city in 2020 (higher means more crime):
| City: | 169.8 |
| U.S. average: | 219.5 |
Travel time to work (commute)
![Travel time to work (commute)]()
- 6Less than 5 minutes
- 405 to 9 minutes
- 6310 to 14 minutes
- 9915 to 19 minutes
- 8420 to 24 minutes
- 8125 to 29 minutes
- 7230 to 34 minutes
- 3035 to 39 minutes
- 3640 to 44 minutes
- 8745 to 59 minutes
- 3360 to 89 minutes
- 890 or more minutes

Means of transportation to work
![Means of transportation to work]()
- 13.2%181Drove a car alone
- 6.0%82Carpooled
- 6.5%89Bus
- 14.4%197Subway or elevated rail
- 3.6%49Long-distance train or commuter rail
- 1.2%17Light rail, streetcar or trolley
- 1.2%17Motorcycle
- 6.2%85Bicycle
- 11.7%160Walked
- 2.9%39Other means
- 34.8%475Worked at home

Time leaving home to go to work
![Time leaving home to go to work]()
- 3312:00 a.m. to 4:59 a.m.
- 165:00 a.m. to 5:29 a.m.
- 75:30 a.m. to 5:59 a.m.
- 556:00 a.m. to 6:29 a.m.
- 236:30 a.m. to 6:59 a.m.
- 767:00 a.m. to 7:29 a.m.
- 787:30 a.m. to 7:59 a.m.
- 948:00 a.m. to 8:29 a.m.
- 918:30 a.m. to 8:59 a.m.
- 669:00 a.m. to 9:59 a.m.
- 3710:00 a.m. to 10:59 a.m.
- 1911:00 a.m. to 11:59 a.m.
- 2012:00 p.m. to 3:59 p.m.
- 234:00 p.m. to 11:59 p.m.

Occupations of males:
- Percentage of males in management occupations (except farmers):
Here: 8.0% city: 9.1%
- Percentage of males in business and financial operations occupations:
Here: 6.6% city: 6.0%
- Percentage of males in computer and mathematical occupations:
Here: 2.3% city: 4.6%
- Percentage of males in architecture and engineering occupations:
Here: 1.3% city: 2.4%
- Percentage of males in life, physical, and social science occupations:
Here: 4.1% city: 1.7%
- Percentage of males in community and social services occupations:
Here: 2.0% city: 1.9%
- Percentage of males in legal occupations:
Here: 1.7% city: 1.8%
- Percentage of males in education, training, and library occupations:
Here: 1.1% city: 4.0%
- Percentage of males in arts, design, entertainment, sports, and media occupations:
Here: 10.9% city: 2.5%
- Percentage of males in healthcare practitioners and technical occupations:
Here: 10.9% city: 4.3%
- Percentage of males in service occupations:
Here: 20.3% city: 19.3%
- Percentage of males in sales and office occupations:
Here: 12.3% city: 14.1%
- Percentage of males in construction, extraction, and maintenance occupations:
Here: 1.3% city: 6.4%
- Percentage of males in production occupations:
Here: 8.2% city: 5.0%
- Percentage of males in transportation occupations:
Here: 13.4% city: 6.9%
Occupations of females:
- Percentage of females in management occupations (except farmers):
Here: 8.3% city: 9.1%
- Percentage of females in business and financial operations occupations:
Here: 10.2% city: 6.6%
- Percentage of females in computer and mathematical occupations:
Here: 4.8% city: 1.7%
- Percentage of females in life, physical, and social science occupations:
Here: 6.3% city: 1.6%
- Percentage of females in community and social services occupations:
Here: 2.1% city: 3.6%
- Percentage of females in legal occupations:
Here: 7.7% city: 1.9%
- Percentage of females in education, training, and library occupations:
Here: 3.7% city: 8.5%
- Percentage of females in arts, design, entertainment, sports, and media occupations:
Here: 9.5% city: 2.4%
- Percentage of females in healthcare practitioners and technical occupations:
Here: 5.3% city: 10.3%
- Percentage of females in service occupations:
Here: 25.7% city: 24.4%
- Percentage of females in sales and office occupations:
Here: 16.5% city: 23.4%
- Percentage of females in production occupations:
Here: 2.0% city: 2.4%
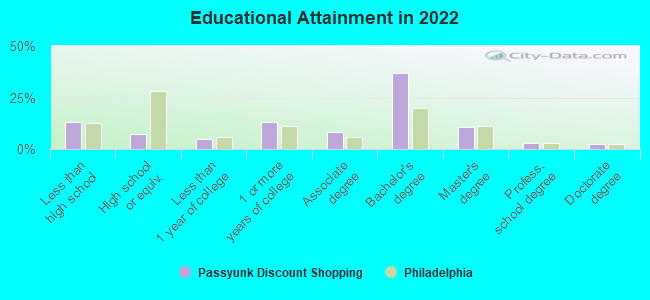
Education in this neighborhood (subdivision or community):
- Percentage of people 3 years and older in K-12 schools:
Passyunk Discount Shopping: 7.5% Philadelphia: 15.6%
- Percentage of people 3 years and older in undergraduate colleges:
Passyunk Discount Shopping: 4.7% Philadelphia: 6.0%
- Percentage of people 3 years and older in grad. or professional schools:
Passyunk Discount Shopping: 6.7% Philadelphia: 2.8%
- Percentage of students K-12 enrolled in private schools:
Passyunk Discount Shopping: 60.5% Philadelphia: 25.0%
Percentage of population below poverty level:
| Passyunk Discount Shopping: | 16.0% |
| Philadelphia: | 21.7% |
Median year owner moved in (as recorded in 2022):
Median year renter moved in (as recorded in 2022):
| Passyunk Discount Shopping: | 2010 |
| Philadelphia: | 2007 |
Median year renter moved in (as recorded in 2022):
| Passyunk Discount Shopping: | 2015 |
| Philadelphia: | 2019 |
Percentage of married-couple families with both working:
| Passyunk Discount Shopping: | 95.6% |
| Philadelphia: | 71.4% |
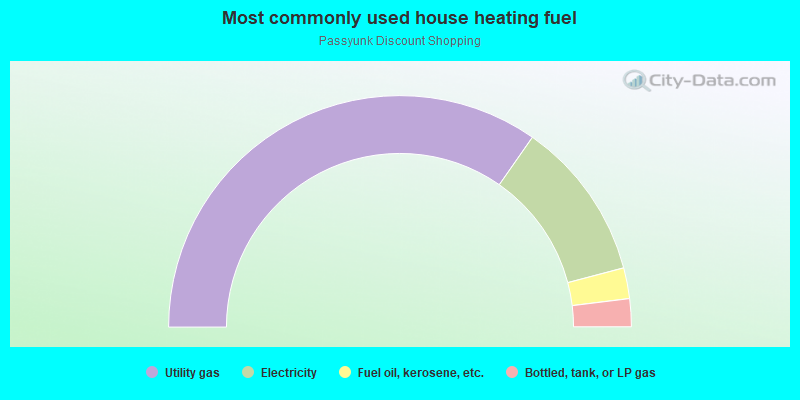
- 69.4%Utility gas
- 22.4%Electricity
- 4.3%Fuel oil, kerosene, etc.
- 3.9%Bottled, tank, or LP gas
Highways in this neighborhood:
Snyder Ave (E Snyder Ave)
Length: 0.03 miles
Direction: E-W
Address range: 1327 to 1362
Direction: E-W
Address range: 1327 to 1362
Roads and streets:
E Passyunk Ave
Length: 0.42 miles
Directions: E-W, SW-NE
Address range: 1600 to 1979
Directions: E-W, SW-NE
Address range: 1600 to 1979
S Juniper St
Length: 0.12 miles
Direction: N-S
Address range: 1939 to 2099
Direction: N-S
Address range: 1939 to 2099
S Watts St
Length: 0.09 miles
Direction: N-S
Address range: 2000 to 2099
Direction: N-S
Address range: 2000 to 2099
S 13th St
Length: 0.06 miles
Direction: N-S
Address range: 1809 to 1899
Direction: N-S
Address range: 1809 to 1899
S 12th St
Length: 0.04 miles
Direction: N-S
Address range: 1700 to 1766
Direction: N-S
Address range: 1700 to 1766
McKean St
Length: 0.03 miles
Direction: E-W
Address range: 1330 to 1363
Direction: E-W
Address range: 1330 to 1363
Pierce St
Length: 0.03 miles
Direction: E-W
Address range: 1200 to 1250
Direction: E-W
Address range: 1200 to 1250
Mifflin St
Length: 0.02 miles
Direction: E-W
Address range: 1227 to 1306
Direction: E-W
Address range: 1227 to 1306
Moore St
Length: 0.02 miles
Direction: E-W
Address range: 1218 to 1248
Direction: E-W
Address range: 1218 to 1248